
If you come to one of our training camps in 2019, you will have the opportunity to ride free of charge with a power meter for three months and enjoy extensive training in how to get the most out of it. The power meter we have chosen is the one that British Cycling, the UCI and many other experts at the top of the sport consider to be the best in the world, the InfoCrank®. It doesn’t matter if you already have a power meter: the offer still stands. If you don’t wish to purchase the InfoCrank® after three months, you simply return it.
This article is however not specific to InfoCranks® power meters and remains equally relevant for starting out with any other brand.
Once your new power meter has been installed on your bike, what next?
Apart from the calibration procedure, the following advice applies no matter which power meter you have.
Setting up the head unit
A power meter is completely useless without the means to display and record the data during the ride. Some power meters are supplied with a dedicated head unit, but all of them will work with the great majority of current head units from brands such as Garmin, Lezyne, Polar, Wahoo (and others).
There are three things you need to do with your head unit before setting out for the first ride:
- Set the screen to display the data you want
- Pair the head unit with the power meter
- Calibrate the power meter.
Let’s look at each of these in turn.
Display
The most basic data you need to display is of course the power. A quick glance through your head unit’s menu, however, will soon reveal a bewildering amount of different power fields, so which one(s) to choose?
All you need for the moment is the basic power number, measured in watts, but we suggest also displaying the cadence, measured in RPM. You can choose to display the power number either raw (in one second increments) or smoothed, typically by a 3s or 10s moving average. We recommend displaying raw power, since this gives you immediate bio-feedback.
The other power fields, such as Normalised Power (NP), Intensity Factor (IF), Left-Right Balance, Pedal Smoothness, Torque Effectiveness, TSS (and more…) are not important for the first month or so. Explaining them is beyond the scope of this introductory article.
Pair the head unit with the power meter
The way to do this varies from one head unit to the next, but in all cases you need to “wake up” the power meter and get the head unit to search for it. Make sure there are no other power meters activated in the vicinity, otherwise your head unit will not know which one to take.
To wake up the InfoCranks® you simply sit on the bike and push for a couple of seconds on each of the cranks.
Select the “search for a new device” function on your head unit, wait for it to find the power meter and then confirm the pairing. If in doubt you can check the serial number of the power meter (which should be displayed by the head unit).
Calibrate the power meter
This is a crucial step: if you fail to calibrate the power meter the readings will be inaccurate. It is a simple process done through the head unit, which should offer you a menu choice to calibrate. In the case of the InfoCranks® the calibration is actually a zero offset and it only needs to be done once, since the calibration is extremely stable and unaffected by environmental conditions. All other power meters should be calibrated before every ride, and the data is liable to drift if the temperature changes significantly.
To calibrate the InfoCranks®, set the cranks vertically and press calibrate on your head unit as many times as needed until the reading is zero (normally 3-4 times is sufficient).
First Rides
For the first few rides, don’t try to do anything different from what you would normally do. The power data is only useful once you have accumulated enough data to establish the baseline that characterises you as a rider.
At a suitable moment in the first ten rides, do some tests. The purpose of these tests is to gather the data needed to define your power training zones.
The test durations are as follows:
- 6 seconds
- 60 seconds
- 6 minutes
- 20 minutes
- 60 minutes
Do not try to do all of them on the same day. We recommend you do the six second and six minute efforts on the same day, the 60 second and 20 minute efforts on a second day and the 60 minute effort on a third day, with breaks in between so that you are well rested and can produce a maximum effort for the required durations.
Make sure you do a thorough warm-up of at least 20 minutes including some short, sharp efforts to get your heart rate up before the tests. When you feel ready, trip the lap timer (so that you can see how much time is left) and ride as hard as you possibly can for the full duration. Make sure you pace yourself so that your power output is as constant as possible from start to finish. It is worth doing several of the 6 second sprints to make sure you reach your peak power, but there is no need to repeat the other durations.
The one hour test is very hard. To get a true maximum you need to be seriously motivated and to find the right route, preferably totally flat with very few junctions. In the UK a 25 mile ITT course is ideal. If you have access to mountains a continuous climb of 15-20 km rising 1000 to 1200m is good.
It is not a disaster if you don’t do the one hour test, but it is important to do it sooner or later to get a true measure of your FTP.
Analysing the data
In order to analyse the data you will need an appropriate software package. These fall roughly into three groups:
- Basic on-line services such as Strava or Garmin Connect, which have limited analytical tools;
- More complete on-line services such as Training Peaks or Cycling Analytics;
- Desk-top software packages such as Golden Cheetah or Training Peaks WKO4 which offer a vast array of analytical tools.
Comparing all these packages is beyond the scope of this article. We ourselves use Cycling Analytics and Golden Cheetah, but the alternatives are equally valid.
Once you have chosen a package and uploaded 10-15 ride files (including the test data) you can start to make sense of it all. There are two basic ways to look at the data: either ride-by-ride, or in aggregate. Whereas the ride-by-ride data enables you to see exactly what happened on any particular ride, the aggregate data is the key to characterising your strengths and weaknesses as a rider and to defining your training zones.
One of the most useful charts is called the Power Curve in Cycling Analytics, the Critical Power (CP) chart in Golden Cheetah and the Power-Duration chart in WKO4. The chart has power on the X-axis and time on the Y-axis (on a logarithmic scale). It displays the maximum average power you have ever recorded, second by second out to the longest ride in your database. This is the uneven upper bound to the coloured data below:

The red line is the data for one single ride: in this case a ride during which the cyclist recorded his best effort in the 25-40 minute range. The software fits a theoretical curve to the measured data, connecting the maximum recordings at certain specific durations. Points where the theoretical curve is above the measured data represent time durations for which the cyclist has not done a true maximum effort.
This chart allows the estimation of Functional Threshold Power (FTP) and Critical Power (CP) as well as your theoretical maximum power for any duration you might be interested in, whether you have tested it or not.
FTP is often used as the reference point for calculating your power zones. The power-duration chart provides the information you need to set your target intensities while training and also to set your pace during competition. We will explain this in depth during our training camps.
The most widely used system was developed by Andrew Coggan:
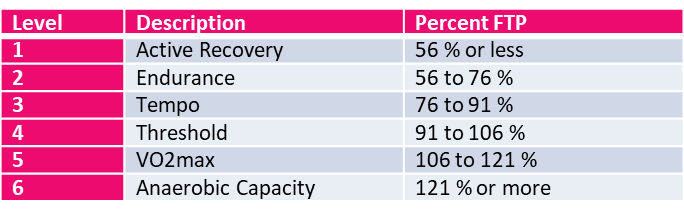
Use this table to calculate your own training zones.
Definitions
FTP and CP are arrived at in different ways, but both represent an estimate of the maximum power you can sustain in a test to exhaustion (TTE) of approximately one hour. For most people this corresponds to the anaerobic threshold (or the second lactate threshold LT2), the point at which your body can no longer process the lactate at the same rate as it is being produced.